
AWS CloudWatch graphs with Librato and a little node
I’ve been playing around with building scaleable applications using Amazon’s AWS platform, and seeing as they are now in Sydney it seemed like now was a great time to take things for a run.
Getting servers up and running is not that hard, but the thing I am most interested in at the moment are Metrics, its critical to be be able to measure and monitor the performance of any part of a running system, this is even more critical on the AWS platform, as their setup encourages you to design for failure. But designing for failure requires an adaptive monitoring solution that can look at key metrics and give you simple health.
Looking into the AWS way of doing this, you obviously find CloudWatch, this is the AWS metrics gathering system. There are lots of resource around the web to understand what it is, and I may do a follow up posting on how to setup your own custom metrics, but as it stands straight out of the box there are lots of pieces of information to play with.
On my test account lots equates to 2,257 CloudWatch metrics.
So once you start to dig into it, there are some metrics that are more useful than others, thinks like the ELB Latency, or RequestCount give a lot more useful figures for me than some of the others.
The AWS console has a simple interface to select Metrics and graph their history, but I found myself clicking around all the time just to have to re-open another metric, and while you can select multiple items on the one graph, you can’t mix scales, or even the calculation mode.
My gut feel is the AWS folks offer a simple interface, and expect you (or me) to build a better solution with the metrics that can be found.
As with all of the AWS features, there is a rich API behind CloudWatch that can be used to not only post metrics, but retrieve them as well.
I had been previously investigating some cloud based graphing tools, and stumbled upon Librato, a quick and easy tool to push time based data at, with a free trial period (just like you should) and a nice cheap price point.
A tiny bit more Google foo and I found a cloudwatch-librato library that seemed to do exactly what I wanted.
But after a bit of playing I still couldn’t get it to work. Partially because I hadn’t done any serious Node.js development before, but partially because the script expected a few things, that I just wasn’t doing. I have my own fork of the library, that you might want to start with, it has:
- Better support for “Off-AWS” execution,
- Some extra Error handling when retrieving CloudWatch metrics,
- Debug support to help you get up and running.
Grab the latest from Github using:
git clone https://github.com/stevemac007/cloudwatch-librato |
First issue I ran into was getting the dependencies installed, start with NPM by installing npm for your platform.
I’m running Cygwin on Windows, so was able to run:
curl http://npmjs.org/install.sh | sh |
The other key missing part was to install Python (needed for the libxmljs module), I started with 3.3, but it seems that it really wants Python >= v2.5.0 & < 3.0.0.
After installing python, run npm to install all the required modules.
npm install underscore optimist aws-lib step librato-metrics |
Once installed, all you need to do is:
- Copy the example settings file,
- Enter your AWS credential in the ‘awskey’ and ‘awssecret’ section of the settings file
- Enter the email and token from Librato
- Configure some services to track
The supplied sample file in the checkout is from the original author, but its quick and easy to add you own by using the AWS console, just open up the CloudWatch console and browse through to a graph you like, for example lets graph the HealthyHostCount for our LoadBalancers per availablity zone.
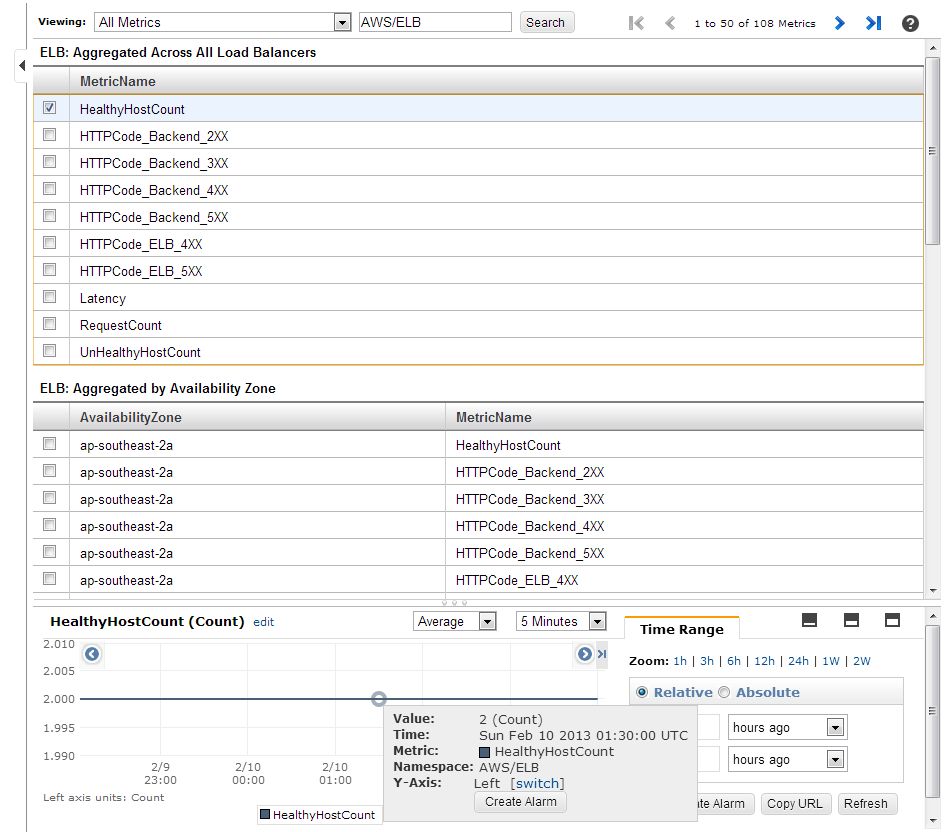
From this screen you have all the information you need to complete the JSON element.
1 2 3 4 5 6 7 8 9 10 11 12 13 | {
"MetricName": "HealthyHostCount",
"Namespace": "AWS/ELB",
"Unit": "Count",
"Period": 60,
"Statistic": "Average",
"Dimensions": {
"ap-southeast-2": [
["AvailabilityZone", "ap-southeast-2a", "se-2a"],
["AvailabilityZone", "ap-southeast-2b", "se-2b"]
]
}
} |
From the screen:
- the Namespace is showing in the “Search” box
- the MetricName is listed in the top section
- the Unit is listed above the graph
- along with the Statistic
- the period needs to be a multiple of 60, and unless you have detailed monitoring enabled, you’ll need to use 300.
Then we need to apply some Dimension filters, here I am creating 2 different graph elements, 1 per AvailabilityZone, and when they are sent to Librato they will appear as ‘se-2a’ and ‘se-2b’.
Now that you have the settings.json file complete, its time to run the script. There is a
--debug
option that allows for some detail to be output when executing the script to show what is going on.
1 | node index.js -c settings.example.json --debug |
and you will see:
1 2 3 4 5 6 7 8 9 10 11 12 13 14 15 16 17 18 19 20 21 22 23 24 25 26 27 28 29 30 31 | Default Region ap-southeast-2
Resolving Metric dimensions.
Metric: HealthyHostCount
Region: ap-southeast-2
batches: {
"60": [
{
"MetricName": "HealthyHostCount",
"Namespace": "AWS/ELB",
"Unit": "Count",
"Period": 60,
"Statistic": "Average",
"Dimensions": {
"ap-southeast-2": [
[
"AvailabilityZone",
"ap-southeast-2a",
"se-2a"
],
[
"AvailabilityZone",
"ap-southeast-2b",
"se-2b"
]
]
}
}
]
}
Scheduled for 60 seconds interval processing.... |
This lists details of the Metrics being processed, in this example it shows just the contents of your metrics files, but when configured with the “_self” and “_instances” options will detail the resolved AWS instance ids.
The script batch’s up all of the metrics on the same period and processes them together. As we only have 1 metric it groups it into a 60 second polling time. Once the 60 seconds have expired, the script will request the Metric Data from CloudWatch and publish it to Librato.
You’ll see it working with some detail like:
**************************************** * Retreiving metrics from CloudWatch * **************************************** HealthyHostCount for ["AvailabilityZone","ap-southeast-2a","se-2a"] ["2.0" Count] HealthyHostCount for ["AvailabilityZone","ap-southeast-2b","se-2b"] ["2.0" Count] **************************************** * Processing and sending results * **************************************** POST to librato [ { "name": "HealthyHostCount", "value": "2.0", "source": "se-2a", "measure_time": 1360469280 }, { "name": "HealthyHostCount", "value": "2.0", "source": "se-2b", "measure_time": 1360469280 } ] |
Once you have a couple of these posted to Librato its time to go check the graphs.
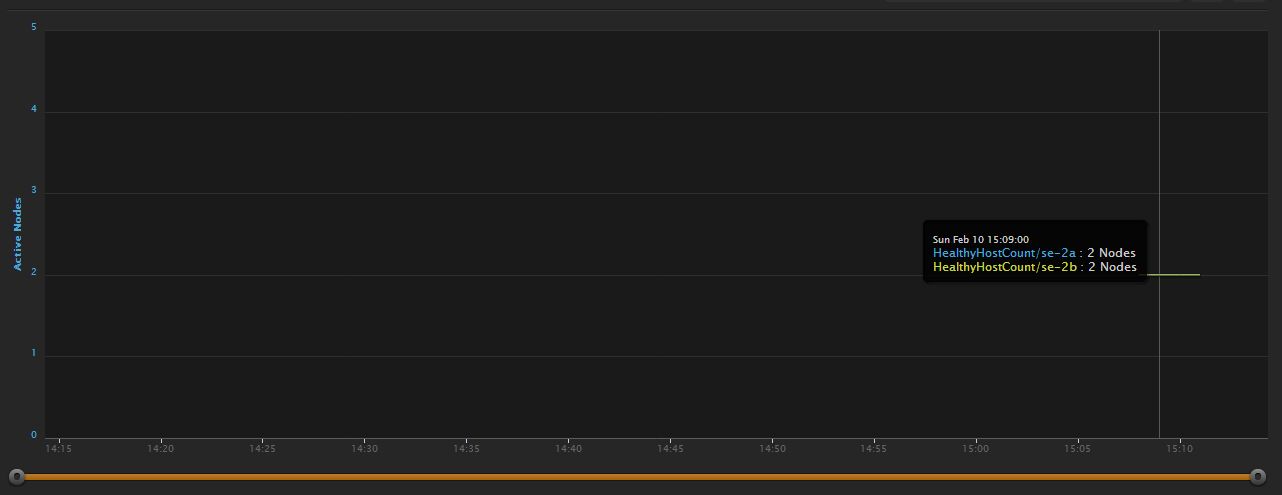
And that’s the lot.
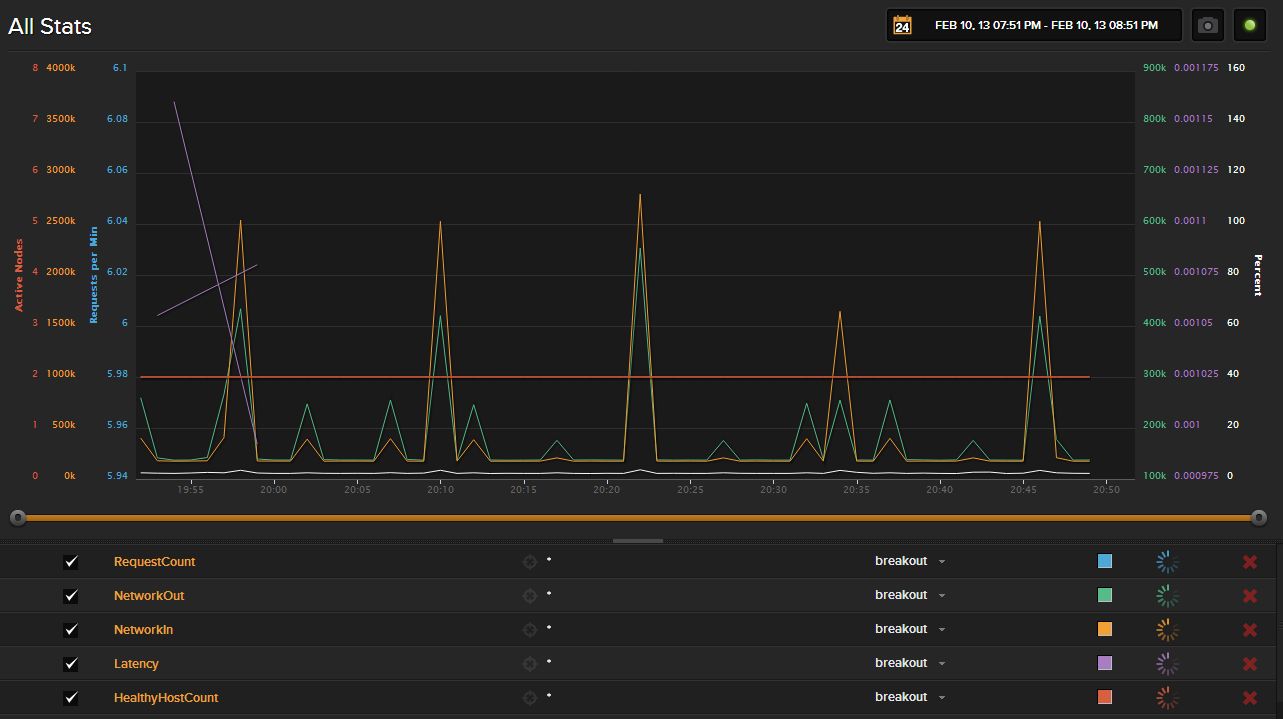
And for a longer running example with some real data, this is what is possible:
Comments